
The digital era has brought us into an age where data is the cornerstone of strategic business decisions.
The ability to effectively process, analyze, and visualize data has become indispensable, and the market is replete with tools to aid businesses in these critical tasks.
Here, we’ve compiled a list of the top 10 data analytics software tools to streamline data processing and visualization, helping businesses understand trends, make informed decisions, and fully leverage their data.
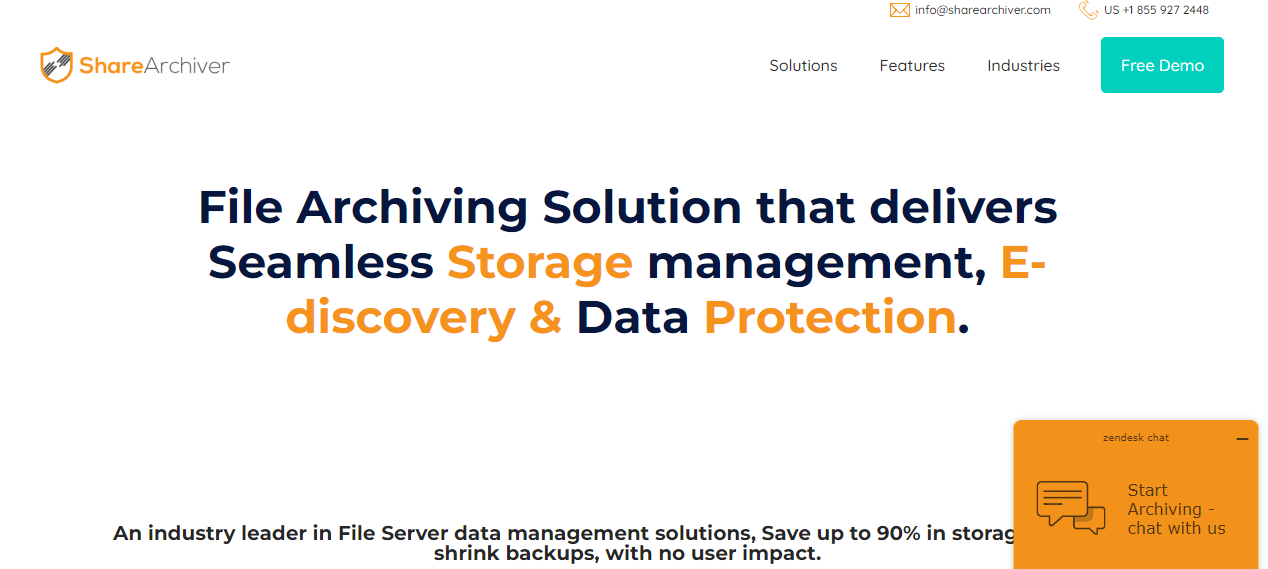
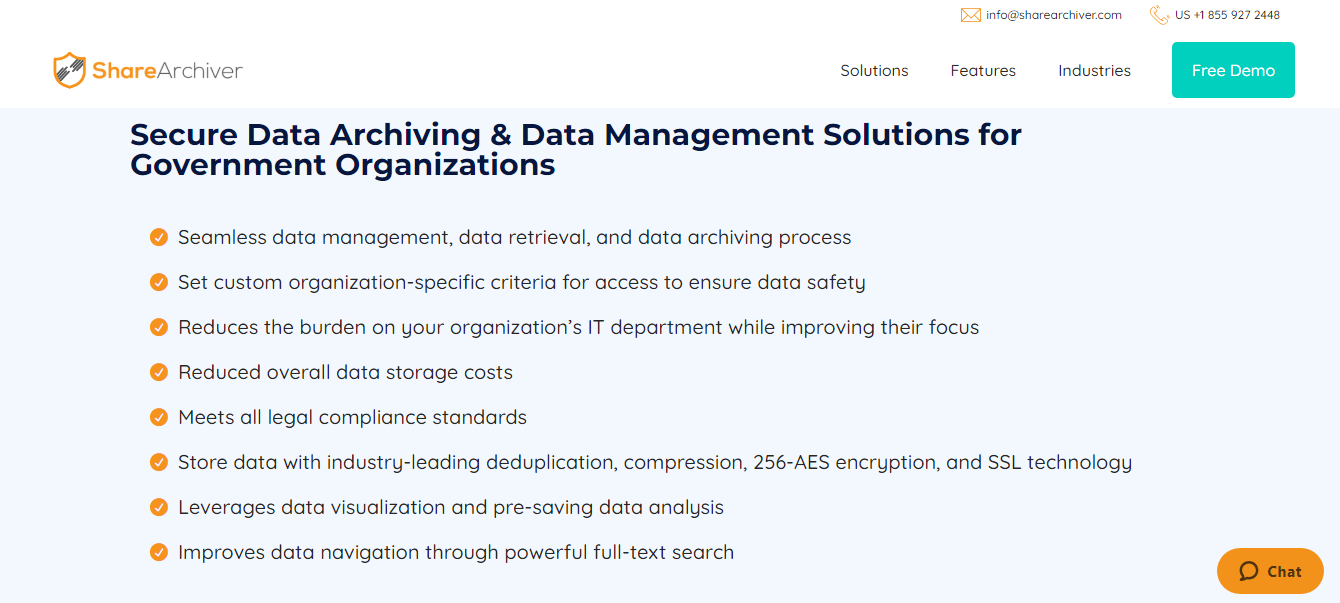
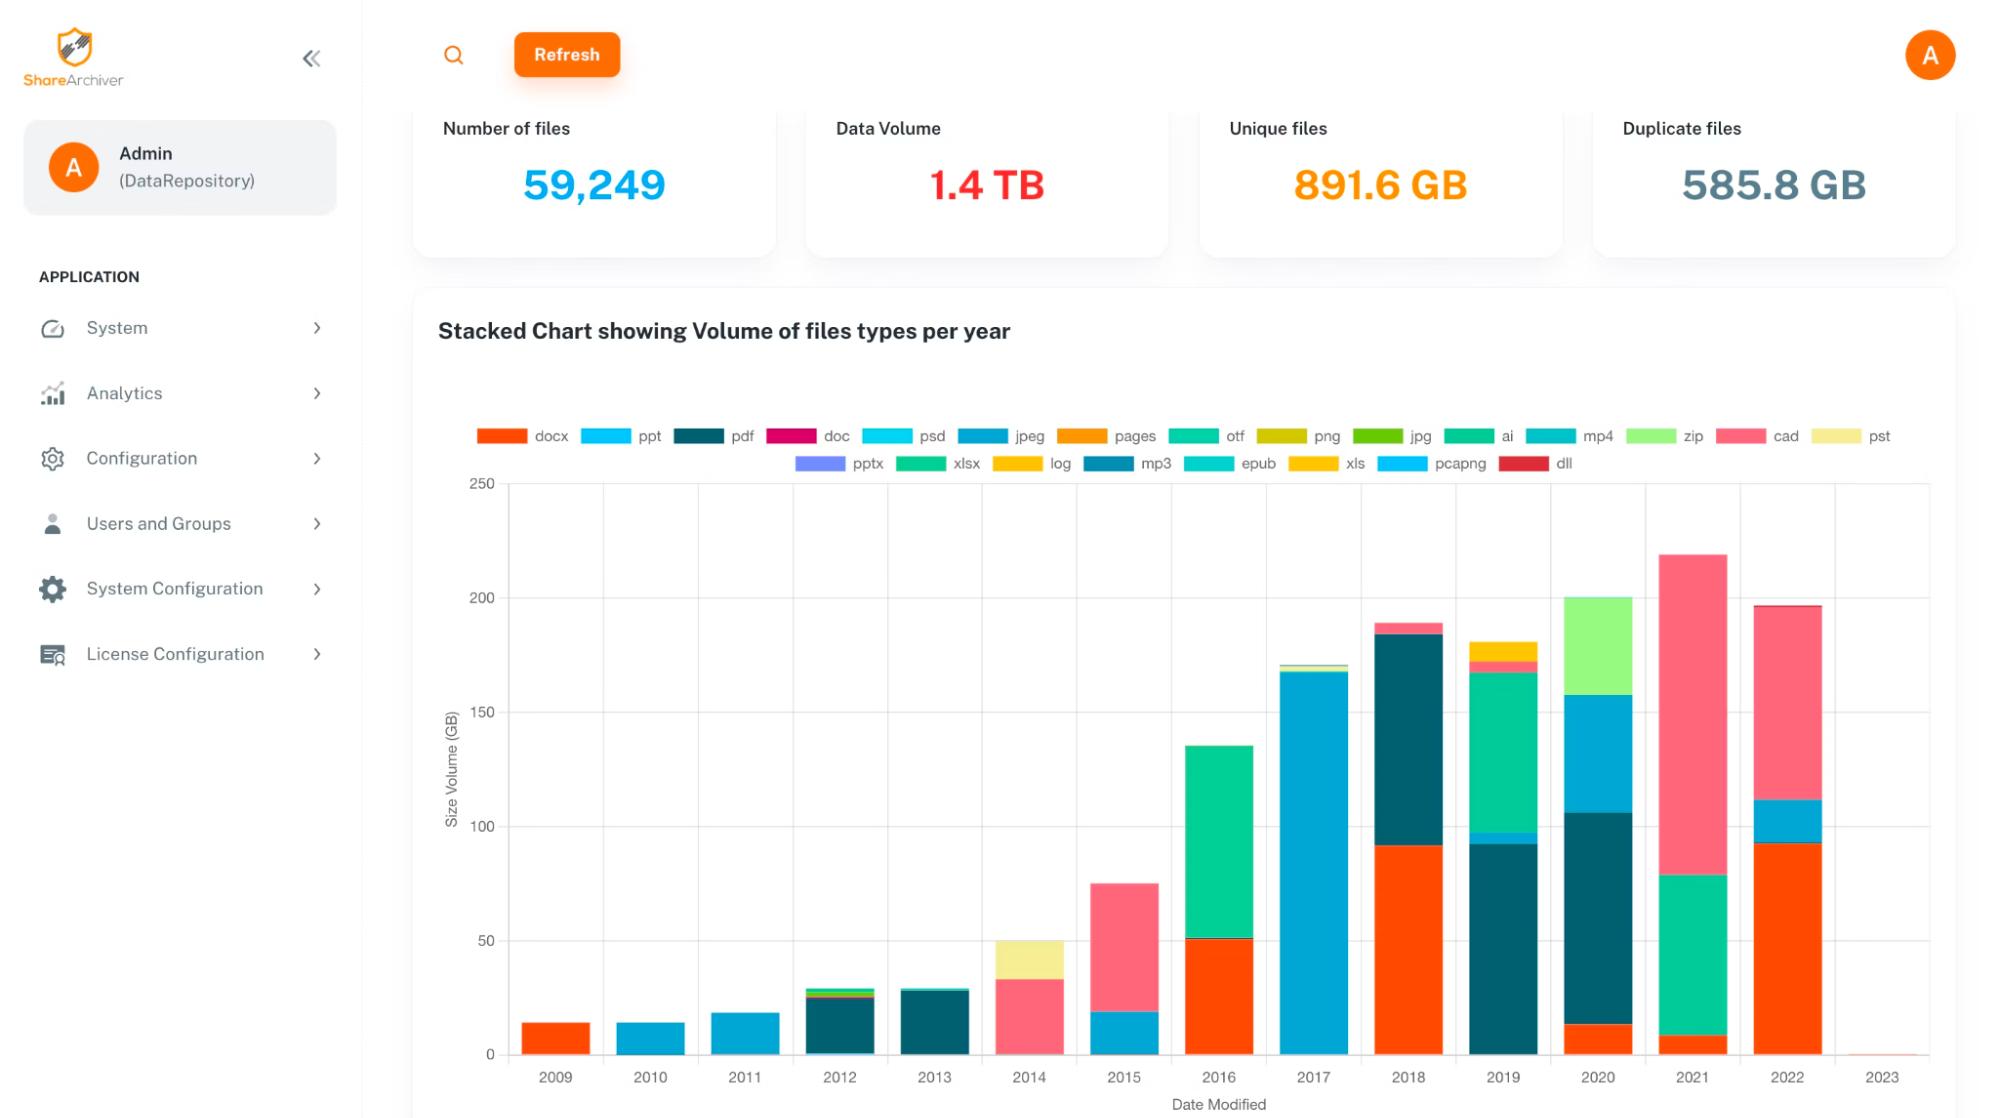
At the top of our list is ShareArchiver, an exceptional tool for data analytics.
It balances an intuitive user interface with powerful functionalities, making it an excellent choice for data novices and experienced analysts.
List of Features
- Advanced Data Analysis
- Data Management
- Data Security
- Interactive Visualization
- User-Friendly Interface
- Predictive Analytics
- Real-time Analytics
- Task Management
- File Management
- Opportunity Management
Top 3 Features
1. Advanced Data Analysis
One of ShareArchiver’s standout features is its advanced data analysis capabilities.
The software allows users to delve deep into their data, dissecting it to reveal valuable insights that might have otherwise remained hidden.
This can be instrumental in helping businesses make data-driven decisions, understanding the implications of certain actions, and discovering trends.
The feature also incorporates AI and machine learning, which can automate parts of the analysis and uncover patterns that a human might miss.
Advanced data analysis with ShareArchiver is about more than just number-crunching.
It’s about providing a platform for meaningful interpretations of data that paves the way for actionable insights.
Whether you’re tracking sales trends or analyzing customer behavior, the advanced data analysis feature of ShareArchiver can provide the tools necessary for detailed and nuanced understanding.
2. Data Management
Another significant feature of ShareArchiver is its data management.
It serves as the backbone of the software, ensuring seamless operations by providing efficient data organization, storage, and retrieval capabilities.
The data management feature can handle vast amounts of data, making it a top preference of large organizations or businesses with high-volume data.
Data management in ShareArchiver also includes file management capabilities.
These allow businesses to organize and manage files efficiently, making the analysis smoother.
Additionally, this feature is designed to ensure data integrity and consistency, which is essential in maintaining the accuracy of analysis results and subsequent decision-making processes.
3. Data Security
Data security is critical to any software dealing with business data.
ShareArchiver excels in this area, providing top-notch security protocols to ensure your data remains safe from breaches or unauthorized access.
The software has integrated measures to protect against data loss, manipulation, and theft, which can be catastrophic for businesses.
In today’s world, where data breaches are increasing daily, ShareArchiver’s robust data security feature provides peace of mind.
It employs state-of-the-art security measures to ensure your data remains secure and confidential.
Furthermore, the software is consistently updated to combat emerging security threats, cementing its place as a reliable data analytics and visualization tool.
Pros and Cons of ShareArchiver
Pros
- Advanced analytics capabilities provide a comprehensive analysis of data.
- Efficient data management tools aid in the smooth operation of data handling tasks.
- Robust data security measures ensure your data is protected from potential breaches.
- A User-friendly interface makes navigating easy for users of all technical levels.
- Real-time analytics provide up-to-the-minute updates and insights.
Cons
Users have not reported any problems with ShareArchiver
Available Platforms
- Windows
- MacOS
- Linux
- Cliud-based
Customer Support
- 24/7 (Live rep)
- Chat
- Help Desk
- Phone Support
- User Training
Pricing
ShareArchiver offers tailored plans according to the requirements of individual clients.
Reach out to ShareArchiver’s sales department for a detailed price quote.
Average Rating
GetApp: 4.7/5
Capterra: 4.7/5
G2: no ratings available yet
Testimonials
Final Verdict
ShareArchiver, with its advanced data analysis capabilities, stands out as an exceptional data analytics tool.
It serves businesses of all sizes and caters to numerous data analysis needs.
The tool is designed to be user-friendly and enables users at all levels to interact with data effectively.
Overall, ShareArchiver provides a comprehensive solution for businesses looking to streamline data processing and visualization.
2. Zoho Analytics
Zoho Analytics is a self-service business intelligence and analytics platform that assists you in analyzing your business data to create reports for informed decision-making.
List of Features
- Predictive Analytics
- Data Import/Export
- Data Discovery
- Dashboard Creation
- Collaboration Tools
- KPI Monitoring
- Drag & Drop Interface
- Automated Reporting
- Data Blending
- SQL Querying
Top 3 Features
1. Predictive Analytics
Zoho Analytics has robust predictive analytics capabilities, a feature that uses historical data and statistical algorithms to predict future outcomes.
This enables businesses to anticipate potential opportunities or challenges and strategize accordingly.
Predictive analytics in Zoho gives businesses a competitive edge and helps them make strategic decisions based on predicted market trends, customer behavior, and sales forecasts.
Moreover, the tool employs machine learning for its predictive analytics, making the predictions more accurate as the system learns from the data over time.
This self-learning model can adapt to changes in business environments and continuously improve its predictive power, providing you with more accurate and actionable insights for future planning and decision-making.
2. Data Import/Export
Data compatibility and seamless integration are vital features for any data analytics tool, and Zoho Analytics excels in this area with its efficient data import/export feature.
This feature allows easy data transfer, making it compatible with countless data formats.
Zoho Analytics supports import from various sources, including local files, web feeds, cloud drives, databases, and popular business applications, increasing its versatility and utility in diverse business environments.
The data export feature also allows users to share their insights and reports with others, increasing collaboration and decision-making efficiency within a team or organization.
Zoho Analytics ensures your data is portable and accessible, allowing you to leverage your insights wherever and whenever needed.
3. Data Discovery
The data discovery feature in Zoho Analytics provides businesses the tools to explore their data thoroughly.
It’s an autonomous exploration feature that identifies patterns, correlations, and anomalies in the data, giving users an in-depth understanding of their data.
This can uncover hidden insights and trends that may not be immediately apparent, helping businesses to leverage their data more effectively.
Furthermore, Zoho Analytics’ data discovery feature goes beyond providing static reports.
It allows users to interact with their data in real-time, adjusting variables and viewing different visualizations for a more dynamic understanding of their data.
This helps businesses gain a more comprehensive view of their data to make decisions accordingly.
Pros
- Efficient customer support services.
- Powerful predictive analytics capabilities allow for accurate forecasting.
- The data discovery feature offers a deep dive into the data for hidden insights.
Cons
- Some settings are difficult to follow and adopt.
- Some customers find the features to be very limited as compared to competitors.
- The initial setup might be complicated for beginners.
- Advanced features require a learning curve.
Available Platforms
- Windows
- MacOS
- Android
- iOS
Integrations
Zoho Analytics offers seamless integrations with other Zoho products. In addition to this, Zoho Analytics integrates with:
- Google Drive
- Microsoft Excel
- Dropbox Business
- Mailchimp
- OneDrive
Customer Support
- Knowledge Base
- Help Desk
- Phone Support
- FAQs
- Forum
- 24/7 (Live rep)
Pricing
Zoho Analytics provides several pricing options, from a free version for small businesses or individual users to a more comprehensive enterprise solution.
It has different plans for cloud data analytics and on-premise services.
- On-Premise:
- Local Server: Professional plan for $30 /user/month billed annually for a minimum of 5 users
- AWS: Professional plan for $0.25/hr + AWS usage fee for a minimum of 5 users
- Azure: Professional plan for $0.40/hr + Azure infrastructure fee for a minimum of 5 users
- Docker: Professional plan for $30/user/month billed annually for a minimum of 5 users
- All categories offer a free version.
- Cloud Services:
- All Cloud Services plans have a free trial.
- Monthly Plans
- Basic: $30
- Standard: $60
- Premium: $145
- Enterprise: $575
- Yearly Plans
- Basic: $24/month billed yearly
- Standard: $48/month billed yearly
- Premium: $115/month billed yearly
- Enterprise: $455/month billed yearly
Average Rating
GetApp: 4.4/5
Capterra: 4.4/5
G2: 4.2/5
Testimonials
Final Verdict
With its powerful predictive analytics, seamless data import/export, and thorough data discovery features, Zoho Analytics is a compelling choice for businesses of all sizes.
Despite a steep learning curve for beginners, the depth of insights provided by this tool is well worth the initial effort.
Overall, Zoho Analytics is a solid, versatile, and user-friendly platform for any business seeking to enhance its data analysis capabilities.
3. SAS Visual Analytics
SAS Visual Analytics is an intelligence and analytics platform that allows users to visually explore data, create and share interactive reports and dashboards, and use analytics to identify significant relationships, outliers, clusters, trends, and more.
List of Features
- Data Management
- Data Visualization
- Real-time Analytics
- Interactive Reporting
- Predictive Analytics
- Advanced Data Discovery
- Cloud-Based
- Integration with Open Source Languages
- Mobile Compatibility
- Advanced Security
Top 3 Features
1. Data Management
SAS Visual Analytics takes the complexity out of data management with its integrated tools.
The software allows users to handle various data management tasks, including cleaning, integration, and transformation.
Streamlining data from multiple sources into a consistent format significantly simplifies the data analysis.
SAS ensures that your data is accurate and readily available, serving as a reliable foundation for your analytics tasks.
Moreover, the platform automates many of the typically labor-intensive data-cleaning processes, reducing the potential for errors and enhancing the overall accuracy of the results.
This efficiency level in data management can be a game-changer, particularly for large-scale businesses that handle vast amounts of data.
2. Data Visualization
One of SAS Visual Analytics’ standout features is its capability for data visualization.
Providing a range of charts, graphs, and maps allows users to present complex data sets as visually appealing and easily understandable formats.
This feature aids in translating raw data into a more digestible and interpretable format, significantly enhancing data comprehension.
Furthermore, SAS’s data visualization tools are designed to be interactive, allowing users to manipulate the visuals and gain different perspectives on their data.
This dynamic approach to data visualization can uncover hidden patterns, trends, and insights, enabling businesses to gain a deeper understanding of their data and make more informed decisions.
3. Real-Time Analytics
Providing real-time analytics is a key feature of SAS Visual Analytics.
It provides up-to-the-minute insights to businesses to monitor their operations in real-time and respond swiftly to any changes.
By offering real-time analytics, SAS Visual Analytics helps businesses stay ahead of the curve, equipping them to anticipate trends and adjust their strategies promptly.
Moreover, the real-time analytics feature is complemented by SAS’s advanced alert system, which sends notifications when certain conditions are met or thresholds are crossed.
This enables businesses to stay on top of potential issues, address them promptly, and mitigate any negative impact.
SAS’s real-time analytics feature is a substantial asset in a business landscape where timing is critical.
Pros
- Easy to use.
- Extensive data visualization tools simplify the understanding of complex data.
- High-speed functionality makes it quick and easy to use.
Cons
- The interface might be overwhelming for beginners.
- Tricky to understand and use for people from a non-coding background.
- Customer support faces immense delays.
Available Platforms
- Windows
- MacOS
- iOS
- Android
Integrations
SAS Visual Analytics integrates with all AWS platforms. Additionally, it integrates with:
- Google Cloud Storage
- Microsoft Azure
- OpenShift
- SAS Customer Intelligence 360
- Google Cloud Compute Engine
Customer Support
- Knowledge Base
- Chat
- 24/7 (Live rep)
- FAQs
- Forum
- Help Desk
- Phone Support
Pricing
SAS Visual Analytics provides a range of pricing options depending on the size and needs of the business.
More details can be obtained from the SAS team.
Average Rating
- GetApp: 4.3/5
- Capterra: 4.3/5
- G2: 4.3/5
Testimonials
Final Verdict
SAS Visual Analytics is a powerful tool that offers a wide array of data analytics capabilities.
Its strong data management, visualization, and real-time analytics features make it a compelling choice for businesses looking for advanced analytics solutions.
The platform may be overwhelming for new users and relatively costly for smaller businesses.
Still, its robust functionalities and flexibility make it a worthy investment for businesses aiming for in-depth data analysis and visualization.
4. SAP Analytics Cloud
SAP Analytics Cloud is an all-in-one business intelligence, planning, and predictive analytics platform. It empowers businesses to make end-to-end decisions confidently.
List of Features
- Reporting/Analytics
- Visual Analytics
- Data Management
- Predictive Analytics
- Collaboration Tools
- Real-time Data Access
- Customizable Dashboards
- Data Exploration
- Cloud-Based
- Integration with SAP and Non-SAP Solutions
Top 3 Features
1. Reporting/Analytics
A key feature of SAP Analytics Cloud is its reporting and analytics capabilities.
The platform allows businesses to generate detailed reports that track performance across various metrics, helping them to measure their success and identify areas for improvement.
With this feature, businesses can convert their raw data into meaningful information, clearly understanding their operations and the market trends that affect them.
Moreover, the analytics feature goes beyond basic reporting.
It offers the capability to drill down into the data, exploring different dimensions and generating insights that may not be apparent at a surface level.
This ability to dig deep into the data can be instrumental in uncovering hidden opportunities or potential challenges, enabling businesses to strategize effectively and make informed decisions.
2. Visual Analytics
Visual Analytics is another prominent feature of SAP Analytics Cloud.
The platform provides various tools that allow users to create appealing and interactive representations of their data.
From simple bar charts to complex maps, users can choose the visualization that fits their data and the insights that must be conveyed.
This can greatly simplify interpreting complex data and make insights more accessible to all stakeholders.
Furthermore, SAP’s visual analytics are highly customizable.
Users can tailor their dashboards to meet their needs, choosing the data points to include, the level of detail to display, and the layout that best conveys their message.
This level of customization allows businesses to create unique, powerful visualizations that truly reflect their data and the insights it holds.
3. Data Management
Data management is crucial to any data analytics platform, and SAP Analytics Cloud excels in this area.
The platform provides comprehensive data management tools that allow businesses to organize, manage, and access their data efficiently and effectively.
Whether it’s handling large data volumes, integrating data from multiple sources, or ensuring data quality, SAP Analytics Cloud has the capabilities to manage it all.
In addition, the platform provides real-time data access.
This means that users can access the latest data anytime, ensuring that their analyses and decisions are based on the most up-to-date information.
By providing real-time data access, SAP Analytics Cloud enhances the insights’ accuracy and relevance, facilitating more effective decision-making.
Pros
- Intuitive interface makes it easy to use the software.
- Visual analytics capabilities allow for easy interpretation and presentation of data.
- The cloud-based solution allows for accessibility from anywhere.
- The high degree of customizability to meet specific business needs.
Cons
- Using the software with too much data causes lags in the system.
- Integration with non-SAP solutions can be improved.
Available Platforms
- Windows
- MacOS
- iOS
Integrations
- Google Drive
- Meta for Business
- QuickBooks Online Advanced
- Workato
Customer Support
- FAQs
- Forum
- Knowledge Base
- Chat
- Help Desk
- Phone Support
Pricing
- Business Intelligence: from $36 per User / Month
- Planning: Price upon request
Average Rating
- GetApp: 4.4/5
- Capterra: 4.4/5
- G2: 4.2/5
Testimonials
Final Verdict
With its advanced reporting and analytics capabilities, versatile visual analytics, and effective data management, SAP Analytics Cloud is a powerful tool in business intelligence and data analytics.
While its pricing might be on the higher end and the interface could be complex for beginners, its comprehensive features and flexibility make it a worthwhile investment for businesses seeking an all-in-one solution for their data analytics needs.
5. IBM Cognos Analytics
Cognos Analytics, offered by IBM, is an AI-fueled business intelligence platform that offers data exploration, data preparation, and report authoring in a single solution.
It equips businesses with the tools necessary to create compelling visualizations and make informed decisions.
List of Features
- KPI Monitoring
- Reporting and Analytics
- Data Visualization
- AI Assistance
- Data Preparation
- Real-time Reporting
- Smart Exploration
- Advanced Analytics
- Collaboration Tools
- Scalable Architecture
Top 3 Features
1. KPI Monitoring
Cognos Analytics offers robust KPI monitoring capabilities, allowing businesses to track and measure their performance against their strategic goals effectively.
The KPI monitoring feature enables users to define their key performance indicators, set their target values, and monitor their progress over time.
This not only helps businesses to assess their current performance but also enables them to identify areas of improvement.
Moreover, Cognos Analytics provides dynamic KPI dashboards customizable to the specific needs of a business.
These dashboards present real-time data on the KPIs, providing an at-a-glance view of the performance.
These dashboards’ visual nature helps simplify complex data and make it easily understandable, facilitating quicker and more informed decision-making.
2. Reporting and Analytics
Cognos Analytics provides various tools enabling users to create detailed, interactive reports and perform in-depth data analysis.
These tools allow users to explore their data from various angles and levels of detail to discover patterns, trends, and insights that can guide their decision-making.
Moreover, Cognos Analytics supports pre-defined and ad-hoc reporting, providing the flexibility to cater to different business needs.
Whether you want to generate a standard monthly sales report or perform a spontaneous analysis to respond to a sudden market change, Cognos Analytics has covered you.
The platform’s reporting and analytics capabilities can empower businesses to convert their raw data into actionable insights.
3. Data Visualization
The platform offers various visualization options, allowing users to represent their data most effectively and meaningfully.
In addition to its variety, the data visualizations in Cognos Analytics are also highly interactive.
Users can manipulate the visuals, adjust the variables, and drill down into the data, providing a dynamic and engaging way to explore and understand their data.
This level of interactivity can reveal hidden insights and deepen the user’s understanding of their data, leading to effective and informed decision-making.
Pros
- Efficient KPI monitoring allows for effective performance tracking.
- Comprehensive reporting and analytics tools provide insightful data analysis.
- Versatile data visualization options for better data interpretation.
- AI assistance enhances data exploration and discovery.
- The scalable architecture supports business growth.
Cons
- The software consumes a lot of space on the systems
- Software suffers periodic lags when working with large data sets
- The information on errors is incomplete which makes it difficult to solve the issue
Available Platforms
- Windows
- MacOS
- Android
- iOS
Integrations
- MongoDB
- Key Survey
- Limelight
- Login ERP
- Husky Intelligence
Customer Support
- Phone Support
- Knowledge Base
- Help Desk
Pricing
- On Demand
- Standard: $10/user/mo
- Premium: $40/user/mo
- On Cloud Hosted
- Mobile: $5/user/mo
- Viewer: $40/user/mo
- User: $80/user/mo
- Client Hosted
- Mobile: $5/user/mo
- Viewer: $12/user/mo
- User: $40/user/mo
- Explorer: $75/user/mo
- Admin: $450/user/mo
Average Rating
- GetApp: 4.2/5
- Capterra: 4.2/5
- G2: 4/5
Testimonials
Final Verdict
With its efficient KPI monitoring, comprehensive reporting and analytics, and versatile data visualization features, Cognos Analytics provides a robust business intelligence solution.
Despite a steep learning curve for beginners and potentially higher pricing for smaller businesses, its advanced features and scalability make it a worthwhile investment for businesses aiming for data-driven decision-making.
6. Oracle Analytics Cloud
Oracle Analytics Cloud is a secure yet scalable public cloud service offering collaborative analytics for personal use, workgroup, and enterprises.
List of Features
- Data Analysis
- Data Discovery
- Data Import/Export
- Predictive Analytics
- Collaboration Tools
- Mobile Compatibility
- Real-time Reporting
- Advanced Data Visualization
- AI and Machine Learning abilities
- Secure Cloud Infrastructure
Top 3 Features
1. Data Analysis
Oracle Analytics Cloud stands out with its comprehensive data analysis capabilities.
It provides a robust suite of tools for analyzing data, enabling businesses to derive valuable insights that inform strategic decision-making.
The platform supports various forms of data analysis, including statistical, trend, and even predictive analysis, catering to a wide spectrum of business needs and objectives.
In addition to the variety, Oracle Analytics Cloud excels in its data analysis depth. It allows users to delve into their data, exploring different layers and dimensions to uncover nuanced insights.
This level of detailed analysis can reveal subtle patterns and relationships in the data that may not be apparent at a surface level, enabling businesses to gain a deeper understanding of their operations and the market dynamics that affect them.
2. Data Discovery
Data discovery is another key feature of Oracle Analytics Cloud.
This feature allows users to explore their data freely, identifying patterns, trends, and anomalies that can provide valuable insights.
Data discovery in Oracle Analytics Cloud is not limited to structured queries or pre-defined reports; instead, it encourages spontaneous exploration, fostering a more intuitive and creative approach to data analysis.
Furthermore, Oracle’s data discovery feature is powered by machine learning, which enhances its capability to detect patterns and correlations in the data.
As the system learns from the data over time, its capacity to provide meaningful insights improves, making data discovery more efficient and effective.
This blend of user-driven exploration and machine-driven learning makes Oracle Analytics Cloud a powerful tool for data discovery.
3. Data Import/Export
Oracle Analytics Cloud excels in handling data import and export, ensuring seamless data integration and compatibility with various data formats and sources.
The platform allows users to import data from various sources, including local files, databases, and cloud services, enhancing its versatility and adaptability in diverse data environments.
On the export side, Oracle Analytics Cloud enables users to export their data and insights in various formats, facilitating data sharing and collaboration.
Whether you need to share a report with your team, present your insights to stakeholders, or integrate your data with other business applications, Oracle Analytics Cloud’s data import/export feature makes it a breeze.
Pros
- Comprehensive data analysis tools allow for in-depth insights.
- The data discovery feature enables intuitive exploration of data.
- Seamless data import/export enhances data integration and compatibility.
- AI and machine learning capabilities enhance data analysis and discovery.
- Secure cloud infrastructure ensures data protection.
Cons
- Requires a relatively speedy internet connection for seamless operations
- Expensive as compared to alternatives
- It could be complex for beginners to navigate.
Available Platforms
- Windows
- MacOS
- iOS
- Android
Integrations
- Microsoft PowerPoint
- iOS14
- Espresso
Customer Support
- Help Desk
- FAQs
- Forum
- Knowledge Base
- Phone Support
- 24/7 (Live rep)
- Chat
Pricing
- Oracle Analytics Cloud – Enterprise: $80.00 per User per month
- Oracle Analytics Cloud – Professional: $16.00 per User per month
- Oracle Analytics Cloud – Professional – BYOL: $0.3226 OCPU per hour
- Oracle Analytics Cloud – Enterprise – BYOL: $0.3226 OCPU per hour
- Oracle Analytics Cloud – Professional: $1.0753 OCPU per hour
- Oracle Analytics Cloud – Enterprise: $2.1506 OCPU per hour
- Oracle Analytics Server for Oracle Cloud Infrastructure: $1.75 OCPU per hour
Average Rating
- GetApp: 4.3/5
- Capterra: 4.3/5
- G2: 4/5
Testimonials
Final Verdict
With robust data analysis capabilities, intuitive data discovery features, and seamless data import/export, Oracle Analytics Cloud presents a comprehensive solution for businesses’ data analytics needs.
Although it may be complex for beginners, and the pricing might be higher, its advanced features, secure cloud infrastructure, and support from Oracle make it a worthy consideration for businesses looking to leverage data analytics for strategic decision-making.
7. Altair Monarch
Altair Monarch is a data preparation and reporting tool that allows you to extract insights from various data sources, including PDFs, spreadsheets, databases, and more. It enables users to convert disparate data sources into a clean, analyzable format.
List of Features
- Reporting and Analytics
- Data Discovery
- Data Storage Management
- Data Import/Export
- Data Transformation
- Visual Data Mapping
- Data Cleansing
- Collaboration Tools
- Integration with Several Data Sources
- Robust Security
Top 3 Features
1. Reporting and Analytics
Altair Monarch offers advanced reporting and analytics that allow businesses to derive meaningful insights from their data.
The platform supports a variety of reporting styles, from standard tabular reports to advanced visual reports, allowing businesses to present their data in the way that best suits their needs.
In addition, Altair Monarch offers a variety of analytics tools that enable in-depth data analysis.
These tools allow businesses to explore their data from different angles and at varying levels of detail.
This can help businesses uncover patterns and trends in their data, identify anomalies and outliers, and generate insights that can guide strategic decision-making.
2. Data Discovery
Data discovery allows users to explore their data freely, uncovering patterns, trends, and anomalies that can provide valuable insights.
Unlike traditional data analysis, often constrained by pre-defined queries and reports, data discovery encourages spontaneous data exploration, facilitating a more intuitive and creative approach to data analysis.
Moreover, the data discovery feature in Altair Monarch is powered by AI and machine learning technologies, enhancing its ability to detect patterns and correlations in the data.
As the system learns from the data over time, its capacity to provide meaningful insights improves, making data discovery more efficient and effective.
3. Data Storage Management
Data storage management is critical to any data analytics platform, and Altair Monarch excels in this area.
The platform offers various tools to manage data storage, including data deduplication, compression, and archiving.
These tools help businesses optimize data storage, reducing costs and improving performance.
In addition to managing the physical storage of data, Altair Monarch also provides tools for managing data access and security.
The platform allows businesses to control who can access their data, when they can access it, and what they can do with it.
This helps protect sensitive data while allowing authorized users to access the needed data to perform their work.
Pros
- Advanced reporting and analytics provide in-depth data insights.
- The data discovery feature encourages intuitive exploration of data.
- Efficient data storage management optimizes data handling.
- Can process data from a wide array of sources.
- Robust data transformation and cleansing capabilities.
Cons
- It may have a learning curve for new users.
- The interface could be more intuitive.
Available Platforms
- Windows
- MacOS
Integrations
- Microsoft SQL Server
- Oracle NoSQL Database
Customer Support
- EmailHelp Desk
- Phone Support
- Knowledge Base
- FAQs
- Forum
- 24/7 (Live rep)
Pricing
Altair Monarch offers a variety of pricing options depending on the size and needs of your business. Reach out to Altair Monarch’s team for a price quote.
Average Rating
- GetApp: 4.6/5
- Capterra: 4.6/5
- G2: 4.5/5
Testimonials
Final Verdict
Altair Monarch is a strong contender in data analytics tools With advanced reporting and analytics, intuitive data discovery, and efficient data storage management features.
While it may have a learning curve for new users and its pricing can be high for smaller businesses, its comprehensive features and adaptability to diverse data sources make it a valuable asset for businesses looking to leverage data for strategic insights.
8. Amazon Kinesis
Amazon Kinesis is a set of tools Amazon Web Services (AWS) provides to process large streams of data records in real-time. It’s designed to load and analyze streaming data.
It can process and analyze data as it arrives instead of waiting for all of the data to be collected before processing.
List of Features
- Data Management
- Scalability
- Real-time Processing
- Stream Data Storage
- Data Security
- Integration with AWS services
- Flexible stream processing
- Easy stream management
- Real-time metrics
- Data encryption
Top 3 Features
1. Data Management
Data management is a standout feature of Amazon Kinesis.
It provides comprehensive tools for handling vast streams of data records in real-time.
The platform allows businesses to capture, process, and store massive amounts of streaming data from various sources, such as social media feeds, website clickstreams, IT Logs, financial transactions, and location-tracking events.
In addition, Amazon Kinesis is designed to ensure data durability.
Once the data is in a Kinesis stream, it’s stored reliably for a default period of 24 hours, extendable up to 7 days.
This allows businesses to review their streaming data and ensure no significant insights have been missed, adding an extra layer of data security and reliability.
2. Scalability
Scalability is another key feature that Amazon Kinesis brings to the table.
As businesses grow and their data requirements increase, the capacity to process and analyze larger volumes of data becomes crucial.
Amazon Kinesis is designed to scale effortlessly to handle large streams of data records, allowing businesses to grow without worrying about their data processing capabilities.
Furthermore, Kinesis provides automatic scaling to handle data throughput, dynamically adjusting as the data input and output rates change.
This auto-scaling feature eliminates manual intervention, making it easier for businesses to focus on deriving insights from their data rather than managing the infrastructure.
3. Real-time Processing
One of the significant advantages of Amazon Kinesis is its real-time data processing capabilities.
Unlike traditional batch processing methods, where data is collected over time and processed, Kinesis enables businesses to process and analyze their data as it arrives in real time.
This allows businesses to react promptly to information as they receive it, enhancing their decision-making capabilities.
In addition, Amazon Kinesis also supports multiple consumers of the same data stream, meaning that the same data can be processed in different ways simultaneously, depending on the business requirements.
This level of flexibility is a powerful tool for businesses that need to perform complex real-time analytics, enabling them to gain multiple insights from the same data stream.
Pros
- Robust data management handles large streams of data efficiently.
- Scalability supports the growth of business data needs.
- Real-time processing allows for immediate data analysis and response.
- Seamless integration with AWS services enhances data handling capabilities.
- Reliable data security measures to protect data integrity.
Cons
- Does not support autoscaling
- Pricing can be complex and difficult to predict.
- Lack of support for non-AWS environments.
- Very less data visibility.
Available Platforms
- Windows
- MacOS
- Linux
Integrations
- Nightfall DLP
- HiveMQ
- Netmera
- KloudMate
- RudderStack
Customer Support
- Help Desk
- FAQs
- Forum
- Knowledge Base
Pricing
Amazon Kinesis offers a pay-as-you-go pricing model, with costs based on the volume of data processed.
Detailed pricing information can be found on the Amazon Kinesis pricing page on the AWS website.
Average Rating
- GetApp: 4.8/5
- Capterra: 4.8/5
- G2: 4.2/5
Testimonials
Final Verdict
With its robust data management capabilities, scalability, and real-time processing, Amazon Kinesis provides a powerful solution for businesses needing to process and analyze large data records.
Despite the potential learning curve for those new to AWS and the complex pricing model, its comprehensive feature set and integration within the AWS ecosystem make it a strong contender in real-time data processing.
9. Azure Stream Analytics
Azure Stream Analytics, provided by Microsoft, is a real-time analytics and complex event-processing system designed to analyze and visualize streaming data in real time.
It provides powerful stream processing capabilities with low latency, helping businesses gain real-time insights from their data.
List of Features
- Reporting/Analytics
- Self-service Analytics
- Data Discovery
- Real-time data streaming
- Integration with Microsoft services
- Scalability
- Time Series Analysis
- Anomaly Detection
- Machine Learning Integration
- Data Security
Top 3 Features
1. Reporting/Analytics
The reporting and analytics feature in Azure Stream Analytics offers an effective way for businesses to transform raw streaming data into actionable insights.
The platform has comprehensive tools allowing users to generate interactive reports and detailed analytics on their data streams.
This, in turn, facilitates a better understanding and interpretation of the data, which can guide strategic decision-making and business actions.
Moreover, Azure Stream Analytics supports various analytics types, from simple descriptive to more advanced and prescriptive analytics.
This allows businesses to understand what is happening now in their data streams, predict what might happen, and determine the best action.
As such, the reporting and analytics feature in Azure Stream Analytics provides a robust solution for businesses to derive maximum value from their streaming data.
2. Self-service Analytics
Self-service analytics is another key feature of Azure Stream Analytics.
This feature empowers users to conduct their data analysis without technical expertise.
With its user-friendly interface and intuitive design, Azure Stream Analytics makes it easy for users to set up and run their analytics tasks, enhancing the accessibility and efficiency of data analysis.
Additionally, Azure Stream Analytics provides users with a rich set of tools and capabilities for self-service analytics.
This includes data exploration tools, analytics functions, visualization options, and more.
Azure Stream Analytics can help businesses democratize data analysis and foster a data-driven culture by giving users the power to perform their analytics.
3. Data Discovery
Data discovery is an essential feature of Azure Stream Analytics, which allows users to delve into their data streams and uncover hidden insights.
By enabling users to explore their data freely, Azure Stream Analytics facilitates a more intuitive and creative approach to data analysis, enhancing the depth and breadth of the insights that can be derived.
In addition, Azure Stream Analytics supports machine learning and AI technologies, enhancing its data discovery capabilities.
These technologies can help the platform to detect complex patterns and relationships in the data, which may not be easily identifiable through manual analysis.
As such, the data discovery feature in Azure Stream Analytics can provide businesses with deep and nuanced insights into their streaming data.
Pros
- Comprehensive reporting and analytics provide detailed data insights.
- Self-service analytics enhances the accessibility and efficiency of data analysis.
- Data discovery enables intuitive and deep exploration of data.
- Seamless integration with other Microsoft services.
- Scalability and flexibility to handle growing data needs.
Cons
- It can be complex for those unfamiliar with Microsoft’s ecosystem.
- Some users report a learning curve.
- It is not the most cost-effective solution for small-scale data streams.
Available Platforms
- Windows
- Mac
- Linux
Integrations
Azure Stream Analytics integrates smoothly with other Microsoft services such as Power BI, Azure Machine Learning, Azure Functions, and more, enhancing its functionality and convenience.
Customer Support
- FAQs
- Forums
- Knowledge Base
Pricing
Azure Stream Analytics follows a pay-as-you-go pricing model, which depends on the volume of data processed.
Average Rating
No reviews are available specifically for Azure Stream Analytics.
Final Verdict
With its robust reporting and analytics capabilities, self-service analytics, and intuitive data discovery features, Azure Stream Analytics offers a comprehensive solution for real-time data processing and analytics.
Although there can be a learning curve for those unfamiliar with the Microsoft ecosystem, and the pricing may not be cost-effective for small-scale data streams, its integration with the broader Microsoft ecosystem and its flexibility makes it a strong choice for businesses looking to harness the power of streaming data.
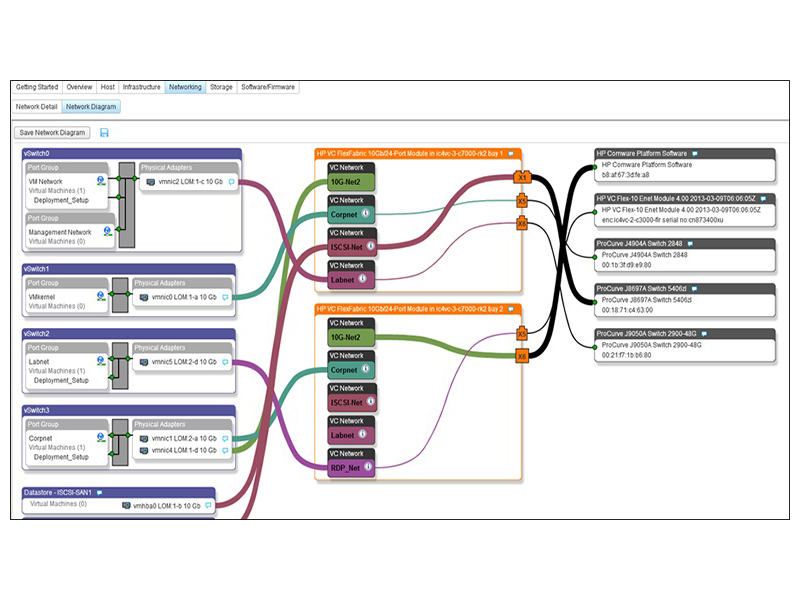
10. Cloudcraft
Cloudcraft is a visual collaboration tool for AWS designed to help businesses visualize their cloud systems in real-time.
It offers a drag-and-drop interface that makes creating professional architecture diagrams for cloud environments easy.
List of Features
- Access Controls/Permissions
- Data Import/Export
- Data Visualization
- Integration with AWS services
- Real-time Updates
- Collaboration Tools
- Scalability
- Secure Infrastructure
- Cloud Cost Estimation
- Compliance Management
Top 3 Features
1. Access Controls/Permissions
Access controls and permissions are a crucial part of Cloudcraft’s feature set.
With these, administrators can define granular access controls, ensuring that only the right individuals can access specific cloud infrastructure resources and diagrams.
This feature not only enhances security but also promotes accountability within the organization.
Moreover, Cloudcraft allows for the setup of user groups with varying permission levels, from view-only access to full administrative rights.
This way, larger teams can effectively collaborate on designing and managing cloud infrastructure while controlling potential risks.
2. Data Import/Export
Data import and export is another valuable feature of Cloudcraft.
It facilitates a smooth flow of information into and out of the platform.
With Cloudcraft, businesses can import data from various AWS resources, allowing them to quickly generate comprehensive and accurate visual representations of their existing cloud infrastructure.
In addition, Cloudcraft also supports the export of these diagrams in various formats, including PNG, PDF, and even 3D.
This makes sharing these visualizations with team members, stakeholders, or clients easy, aiding communication, collaboration, and documentation.
3. Data Visualization
Data visualization lies at the core of what Cloudcraft offers.
This feature enables businesses to create interactive 3D models of their AWS infrastructure, providing a clear and detailed visual representation of their cloud environments.
This can be extremely useful in understanding the relationships between different cloud components, planning changes to the infrastructure, or identifying potential issues.
But Cloudcraft goes beyond just static diagrams.
It offers real-time visualizations, meaning the diagrams automatically update as changes are made to the AWS infrastructure.
This ensures teams have an accurate and up-to-date view of their cloud environment.
Furthermore, Cloudcraft diagrams are not just visually appealing but also actionable.
They provide real-time insights into your cloud costs, performance metrics, and more, enabling informed decision-making and efficient management of cloud resources. Pros and Cons of Cloudcraft
Pros
- Advanced access controls and permissions enhance security.
- Seamless data import/export allows for easy data handling.
- Real-time data visualization provides a clear view of cloud infrastructure.
- Integration with AWS enhances functionality.
- Collaboration features support team-based cloud management.
Cons
- It is limited to AWS environments.
- Could benefit from more integration with non-AWS services.
Available Platforms
- Windows
- MacOS
- Linux
Integrations
Cloudcraft integrates seamlessly with AWS services, providing a streamlined experience for managing AWS cloud infrastructure.
Customer Support
- Knowledge Base
- Help Desk
- Chat
- FAQs
- Forum
Pricing
- Free version available.
- Pro: $490 per user/year. $99 per user when billed monthly
- Enterprise: Contact sales.
Average Rating
- GetApp: 4.8/5
- Capterra: 4.8/5
- G2: 4.5/5
Testimonials
Final Verdict
Cloudcraft, with its advanced access controls and permissions, seamless data import/export, and real-time data visualization features, provides a powerful tool for businesses managing their AWS cloud infrastructure.
While its applicability is currently limited to AWS environments, its comprehensive features and the real-time insights it provides make it a valuable asset for businesses looking to streamline their cloud management processes.
Comparison Table
| Data Analysis | Data Management | Data Security | Realtime Analytics | Data Discovery | Reporting/Analytics | |
| ShareArchiver | ✅ | ✅ | ✅ | ✅ | ✅ | ✅ |
| Zoho Analytics | ✅ | ✅ | ❌ | ❌ | ✅ | ❌ |
| SAS Visual Analytics | ✅ | ✅ | ❌ | ✅ | ❌ | ✅ |
| SAP Analytics Cloud | ✅ | ❌ | ❌ | ❌ | ❌ | ✅ |
| Cognos Analytics | ✅ | ❌ | ❌ | ❌ | ✅ | ✅ |
| Oracle Analytics Cloud | ✅ | ✅ | ❌ | ❌ | ✅ | ❌ |
| Altair Monarch | ✅ | ❌ | ❌ | ❌ | ✅ | ✅ |
| Amazon Kinesis | ❌ | ✅ | ❌ | ✅ | ❌ | ❌ |
| Azure Stream Analytics | ✅ | ❌ | ❌ | ✅ | ✅ | ✅ |
| Cloudcraft | ❌ | ✅ | ❌ | ❌ | ✅ | ❌ |
This table demonstrates the multi-faceted superiority of ShareArchiver, making it an excellent choice for comprehensive data analysis, management, and security.
It stands alone in offering all these capabilities in a single interface.
Best of the Best
- ShareArchiver: The perfect tool for comprehensive data analysis, management, and security. Its key features provide the necessary arsenal for making informed decisions based on secure and well-managed data.
- Zoho Analytics: This business intelligence tool shines with its predictive analytics and data import/export capabilities. It allows users to delve deep into data and draw critical insights.
- SAS Visual Analytics: Recognized for its powerful data visualization and real-time analytics features. This tool enables users to interpret complex data and gather key insights easily.
Conclusion
Data Analytics Software is increasingly critical in helping businesses streamline their data processing and visualization efforts.
Choosing the right tool can profoundly impact a business’s ability to derive actionable insights from its data.
While all the tools reviewed in this article offer impressive capabilities, ShareArchiver stands out for its user-friendly interface, comprehensive feature set, and competitive pricing.
It’s the perfect tool to help you leverage your data to its full potential.
Try ShareArchiver today and experience the difference it makes in your data analytics endeavors.
Buyer’s Guide
1. What is Data Analytics Software?
Data analytics software is a suite of applications that assist in collecting, organizing, and analyzing large data sets to provide meaningful insights.
This kind of software can transform raw data into useful information, helping businesses understand trends, patterns, and relationships within the data.
Data analytics software can be used for various purposes, from boosting sales to improving product development. It involves techniques like data mining, text analytics, predictive analytics, and machine learning.
In short, it turns massive amounts of complex data into an understandable form.
2. What makes a great Data Analytics Software?
A great data analytics software should have a blend of several key attributes.
It should be able to handle large volumes of data quickly and efficiently. It must also have robust data-cleaning features to ensure that the data is accurate.
The software should also offer various data analysis tools, including predictive analytics, data mining, and trend analysis.
Additionally, it should be user-friendly with a clear, intuitive interface and visualizations.
Moreover, it should be easily integrated with other platforms and systems that a business uses.
3. Why should one use a Data Analytics Software?
Companies use data analytics software to gain insights from their data, which can lead to smarter business decisions and strategic moves.
The software can reveal trends that would otherwise be lost in the mass of information, allowing businesses to respond to issues or opportunities more quickly.
Data analytics software can also increase efficiency by automating processes requiring considerable manual effort.
This can free up your team to focus on more strategic tasks, such as interpreting and using the results of the data analysis.
4. How can someone use Data Analytics Software?
There are numerous ways to use data analytics software, depending on your business needs.
Sales teams can use it to track customer behavior and identify opportunities.
Marketing teams can use it to assess the effectiveness of their campaigns and adjust strategies.
On a higher level, executives can use analytics to gain a comprehensive view of business operations, identifying areas for improvement.
For example, you can use predictive analytics to forecast trends, enabling proactive decision-making.
5. Key Features of Data Analytics Software
Key features to look for in data analytics software include:
-
- Data Management: The software should have strong data management capabilities, such as data cleaning, transformation, and integration.
- Advanced Analytics: The software should support advanced analytics techniques, such as machine learning, predictive modeling, and statistical analysis.
- Interactive Dashboards and Reporting: The ability to create interactive dashboards and reports is crucial for presenting data easily.
- Scalability: As your data grows, so should your software’s ability to handle it.
- Security: Your data should always be protected, so robust security measures are crucial.
6. Pros of Data Analytics Software
- Informed Decision-Making: The software can reveal hidden trends and insights, leading to smarter, data-driven decisions.
- Increased Efficiency: Data collection and analysis automation can save time and resources.
- Improved Customer Understanding: Analysis can uncover detailed customer behavior and preferences, enabling you tailor your offerings.
7. Cons of Data Analytics Software
- Cost: Some software, especially advanced systems with extensive features, can be expensive.
- Complexity: Some software can be difficult to use without experience or extensive training.
- Data Privacy Concerns: Handling sensitive data requires robust security features and compliance with data privacy laws.
8. What is This Software Not a Good Fit For?
While data analytics software can be invaluable for many businesses, there may be better fits for very small businesses with limited data. These businesses might not have enough data to analyze for significant insights. Similarly, businesses that do not have the necessary resources to manage and maintain these systems may also struggle.
9. How to Get the Most Value Out of Data Analytics Software?
To get the most out of your data analytics software, ensure it aligns with your business goals. Training your team to use the software properly is also essential. Take advantage of all the features offered, especially those that automate processes and provide deep insights.
Remember, the value of your software is only as good as the data you put into it. Ensure your data is clean, accurate, and updated.
10. How Do We pick the Right Data Analytics Software?
When choosing data analytics software, consider your business needs and resources.
Evaluate the software based on its ease of use, features, integrations, and price.
Also, consider the vendor’s reputation and the quality of their customer service.
Look for software that is scalable and can grow with your business.
A free trial or demo can also be useful for testing whether the software meets your needs.
Finally, consider the future.
Your chosen software should align with your plans and be flexible enough to accommodate changing business needs. Meta Information
FAQs
1. How important is data security in a data analytics tool?
Data security is critical in a data analytics tool. It makes sure your data is protected against unauthorized access and breaches, which is crucial when dealing with sensitive business information.
2. What is the advantage of having real-time analytics in data analytics software?
Real-time analytics let you have immediate insights from your data. This means you can make quick, informed decisions, which is especially valuable in a fast-paced business environment.
3. Can data analytics software help with predictive modeling?
Yes, many advanced data analytics tools come with predictive modeling capabilities. These use historical data to forecast future outcomes, which can be incredibly beneficial for strategic planning.
4. How can data analytics tools aid in data discovery?
Data analytics tools allow you to explore data and identify patterns, trends, and correlations. This data discovery process can lead to valuable insights that drive business growth.
5. Why is data management essential in data analytics software?
Efficient data management ensures your data is consistent, accurate, and easily accessible. This is important for the success of any data analytics efforts.
6. What is the role of artificial intelligence in data analytics software?
AI can automate many aspects of data analysis, reducing the need for manual intervention. It also enables more advanced capabilities, like predictive analysis, machine learning, and natural language processing.
7. How does a good data analytics software enhance business decision-making?
A good data analytics tool transforms raw data into actionable insights, clearly understanding your business operations and enabling you to make data-driven decisions.
8. What types of businesses benefit from data analytics software?
Virtually all businesses can benefit from data analytics software. Whether you’re a small startup or a large corporation, the insights gained from analyzing your data can lead to better strategies and increased efficiency.
9. Is it necessary to have technical skills to use data analytics software?
While some data analytics tools require a basic understanding of programming languages, many are designed to be user-friendly and intuitive, allowing non-technical users to derive valuable insights from their data.